BC-GL-RT13 Profit and Loss Budget Accuracy Analysis
Created by Velixo Team, Modified on Fri, 24 Oct at 4:58 AM by Velixo Team
Applies to
- Product version: Velixo NX
- ERP: Dynamics 365 Business Central
- Functional area: Financials, Budgeting, Other
- Plan: All
- Template type: Production Report template
TABLE OF CONTENTS
- Applies to
- Description
- Coverage
- Typical audience
- Features
- Preview
- Download this template
- Documentation
- User Guide
- Version History
Description
The BC-GL-RT13 Profit and Loss (P&L) Budget Accuracy Analysis report provides a detailed look at the differences between the budgeted and actual financial performance over a specific period. This report highlights variances in key revenue and expense categories, showing where the forecasts did not match the actual results. By analyzing these differences, the report helps to understand what influenced financial performance, improves future budgeting, and enhances decision-making for better financial planning and control.
Coverage
This workbook includes the following sheets:
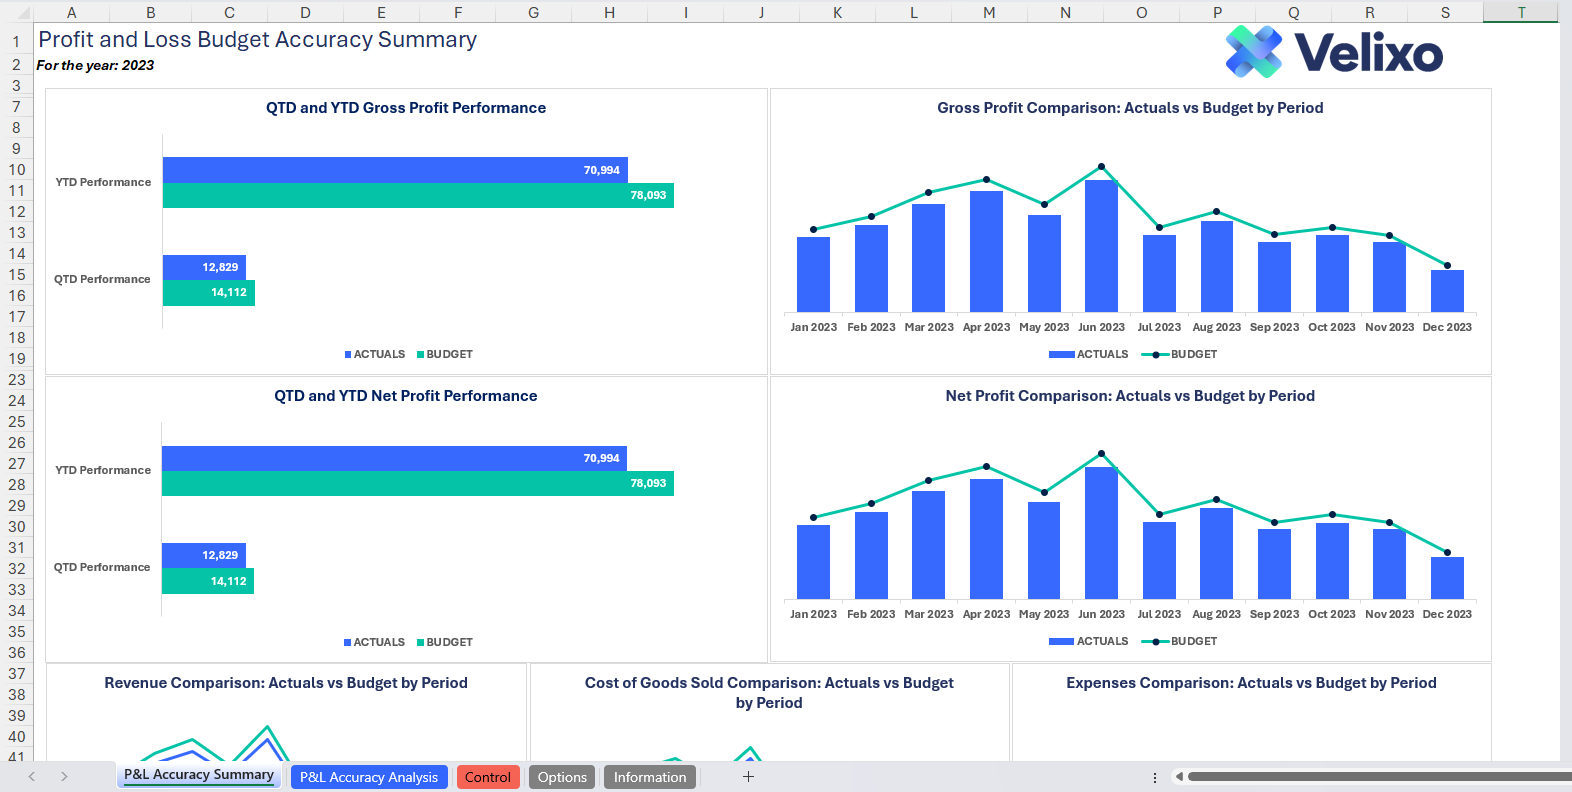
- P&L Accuracy Summary: the charts created from the Profit and Loss (P&L) Budget Accuracy Analysis report. This visually summarizes the variances between budgeted and actual financial performance
- P&L Accuracy Analysis: the Profit and Loss budget accuracy analysis report comprises pre-defined account classes, assigned to various sections for a comprehensive financial overview.
- Control: a control report that can be used to confirm that the data is accurate and balanced.
- Options: the template’s settings sheet that is used for data validation lists and various lookups and configurations.
- Information: the information sheet of the report, used for storing useful details about the report such as code, version, and article link to keep track of the origin of the report.
Typical audience
The typical users of this type of report are Finance professionals: Accountants, CFOs, Controllers
Features
The following features are used by this report. To use this report, please ensure that your Velixo license includes all of them, (or contact Support or Sales):
- Financial functions
- List functions
- Query functions
Preview

Download this template
 Templates will be available for download soon
💡Having trouble downloading the files?
Simply right-click on the link and select Save Link As
Documentation
Navigating and utilizing the BC-GL-RT13 Profit and Loss (P&L) Budget Accuracy Analysis report is straightforward, designed for simplicity, versatility, and efficiency. The template comes pre-configured with generic account categories streamlining the reporting process with minimal user effort.
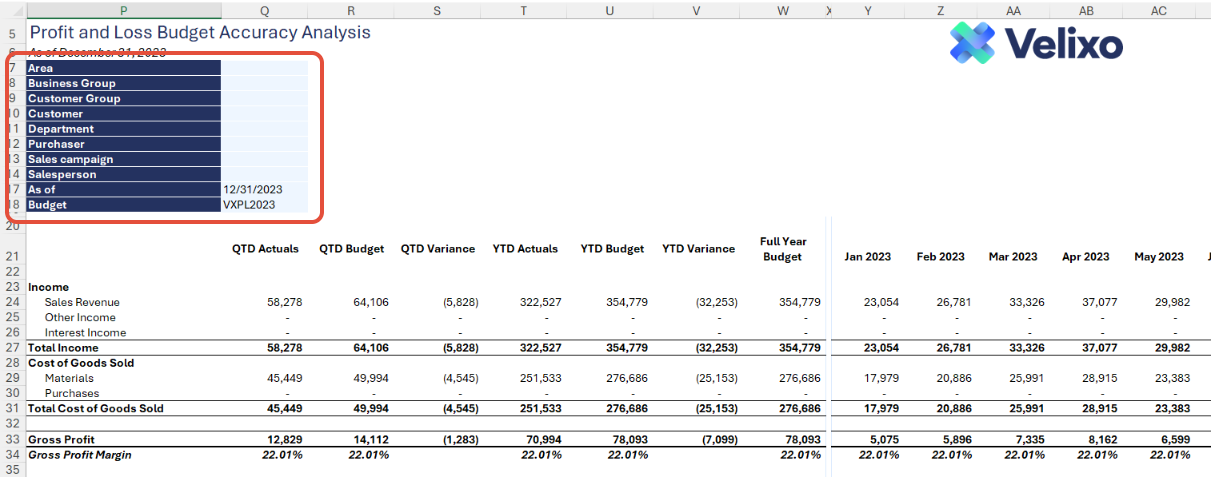
Filters
Located in the upper left of the sheet, the filters include:
- Dimensions: lists all dimensions present in Dynamics 365 Business Central instance
- As of (Period): a date field. Please use the last date of a financial period/month
- Budget ID: for usability purposes, Velixo lists all of your Budget Ids in a dropdown list. Should you want to select more than one, you can also concatenate them in the Filter value field.
These filters are seamlessly linked to the data on the Options tab.

Note: The dimension list updates dynamically based on the number of dimensions configured in your instance. However, the template can process a maximum of 10 dimensions per company. If your instance includes more than 10 dimensions, please contact Velixo Support for assistance.
P&L Structure
Sections: Velixo has thoughtfully structured the P&L using multiple common sections that should be generic, by default.
The following sections are used by default in the report:
- Income
- Cost of Goods Sold
- Operating Expenses
- Non-Operating Expenses
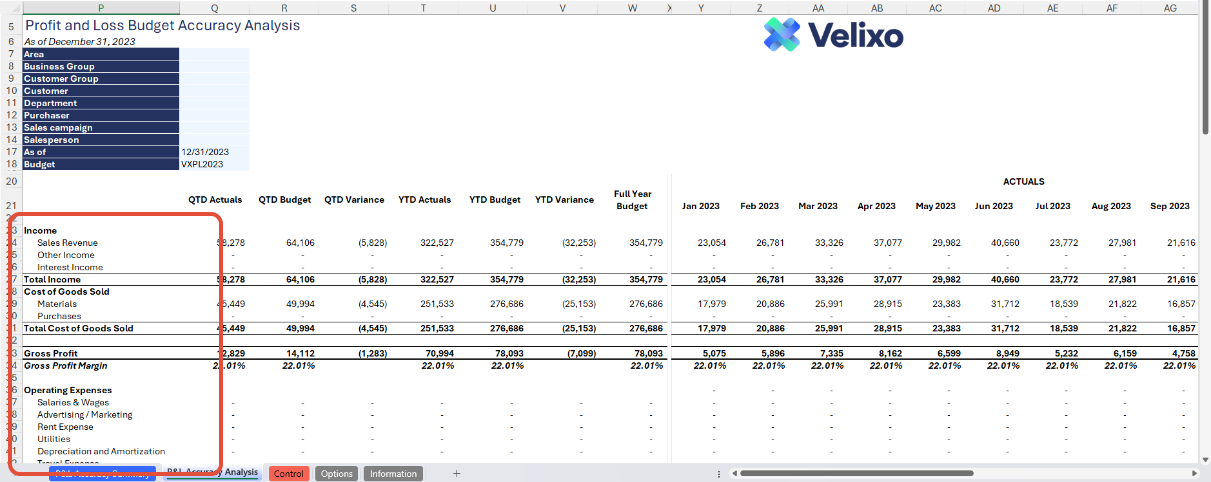
Metrics: The report includes the following metrics:
- On rows:
- Gross Profit Margin %
- Net Profit Margin %

- On Columns:
- QTD Actuals vs QTD Budget
- the turnover balance from the beginning of the quarter up to the date specified in the "As of" filter
- Col S shows the variances in QTD between Actuals and Budget
- YTD Actuals vs YTD Budget
- the turnover balance from the beginning of the fiscal year up to the date specified in the "As of" filter
- Col V shows the variances in YTD between Actuals and Budget
- Full Year Budget: the total budget for the year from the start and up to the end of the fiscal year
- Actuals by Period (Col Y to AJ): the actual turnover balance for each of the period in the fiscal year
- Budget by Period (Col AL to AW): the budget turnover balance for each of the period in the fiscal year
- QTD Actuals vs QTD Budget

Profit and Loss Accuracy Summary
To enhance user understanding, the report includes multiple charts that provide clear visualizations of Profit and Loss, and Actuals vs. Budget data. These charts make it easier to interpret financial performance, identify key variances, and gain insights for improved budgeting and planning.
This sheet features customizable Actuals vs Budget by Period comparisons charts, easily adjusted to suit user preferences and needs:
- QTD and YTD Gross Profit
- QTD and YTD Net Profit
- Gross Profit by Period
- Net Profit by Period
- Revenue by period
- Cost of Goods sold by Period
- Expenses by Period

User Guide
Configuring the report
A quick setup is needed to get the most out of the report. These settings control how balances are pulled from the system and displayed in the report.
Setting Up Account Subcategories or Account Codes/Ranges
Each statement line in the report should be mapped to the corresponding account subcategories or account codes. This mapping defines how Velixo retrieves data from the system. To set this up:
- Expand the grouped columns on the leftmost side of the report
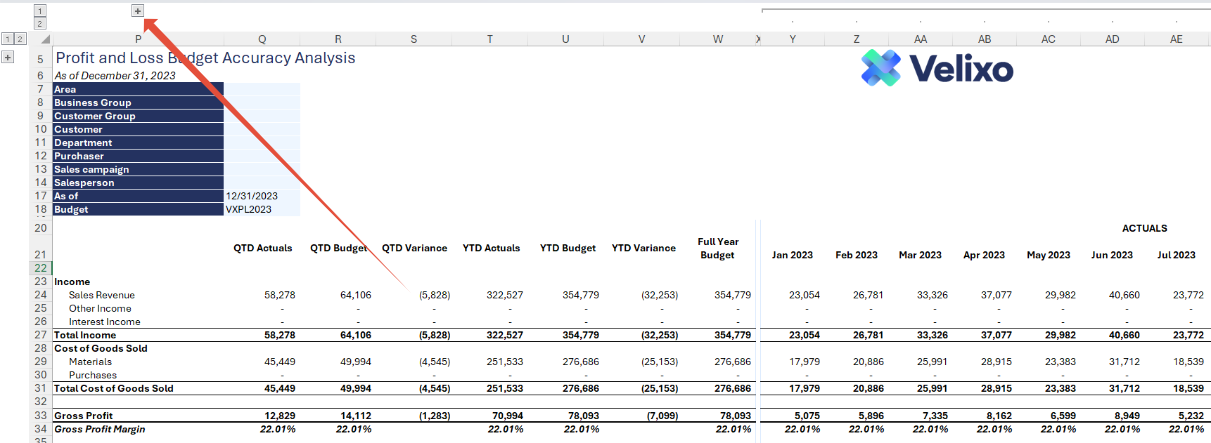
- Doing so will display several configuration columns. The Account Subcategory and Account Code/Range columns can be found in columns D and E
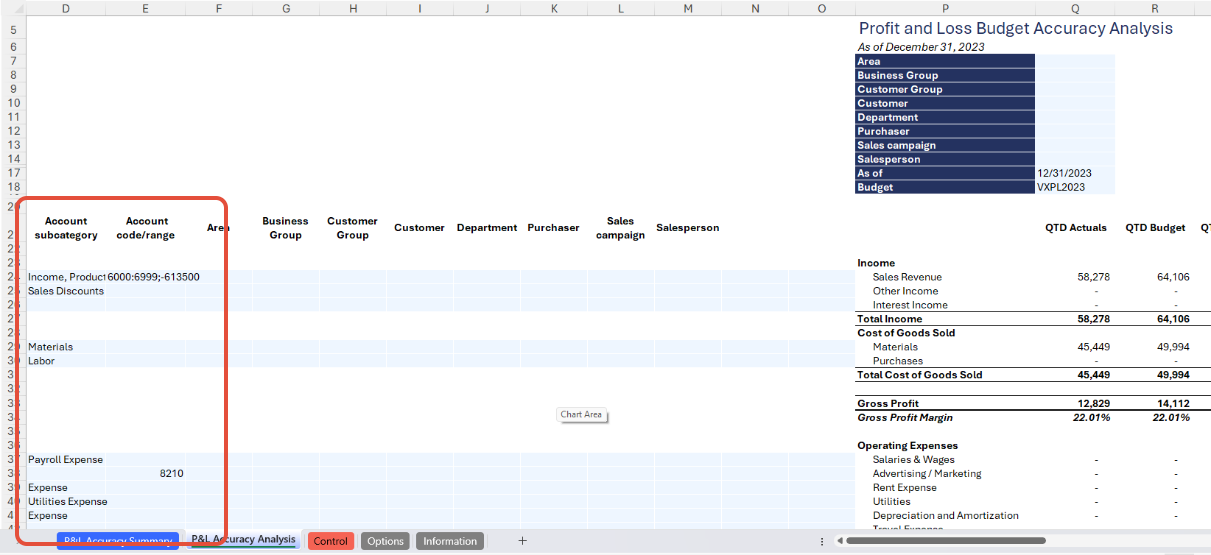
- The report includes default subcategories based on the Velixo demo instance. These may not match your company’s configuration. Update the subcategories or account codes as needed to align with your instance setup.
Note: By default, the Account Code takes priority over the Account Subcategory. If both are specified in the configuration, the template will ignore the subcategory and extract balances based solely on the account code.
Setting Up Dimensions per Statement Line (Optional)
To provide greater customization and flexibility, users can apply dimension filters at the statement line level. The dimension columns span from columns F to O.
The template can process up to a maximum of 10 dimensions per instance. If your system is configured with fewer than 10 dimensions, some columns in the template will remain blank - this is a current template UI limitation and does not affect how the report extracts balances.

Note: The global report filter setup takes priority over statement line level filters when the same dimension is used in both. For example, if the Area dimension is selected at both the global and statement line levels, the value specified in the global filter will take precedence and be used by the report when extracting data.
Using the report
Now that we've covered the report overview, let's dive into a step-by-step guide on effectively utilizing the report:
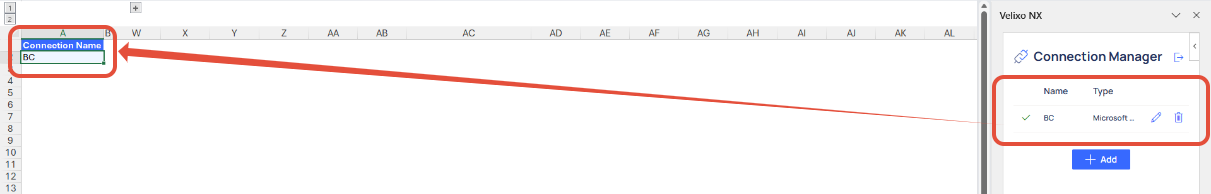
- Set the Connection Name on the Options Sheet: crucial for all processes, set the Connection Name on the Options sheet by updating cell A2. Ensure it matches the name used during Velixo application login.
- Update the Options Sheet: As the foundation for filters on the Profit and Loss Accuracy Analysis report sheet, keep the Options sheet up to date. It should always and automatically capture the latest dimensions and structures from your Dynamics 365 Business Central instance.

- Choose Desired Filters: after updating the Options sheet, select desired global filters for the report:
- Dimensions
- As of (Period)
- Budget ID
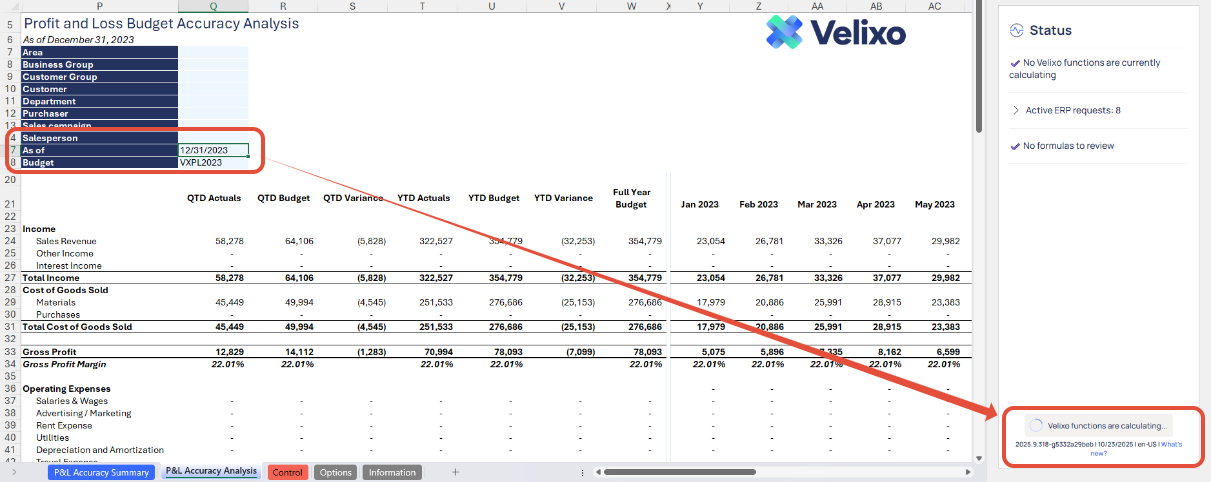
- Automatic Report Update: selecting any filter will automatically update report balances. Begin analyzing the report with the latest data.
- Variances Investigation: if discrepancies arise between data extracted at the account subcategory and account code levels, conduct a thorough investigation to resolve any differences.
Using the Control report
Committed to upholding data integrity across the report and Dynamics 365 Business Central, the Control sheet serves as a supplementary component to the primary Profit and Loss sheet. Its purpose is to validate the data extracted by Velixo on an account category basis by cross-referencing it with the extracted balances at the account code level.
Given that the balances of the account codes aggregate to the account category, the Control sheet ensures the absence of discrepancies in the total for each account type. This verification process enhances the reliability and accuracy of the overall financial reporting template.
The Control sheet is divided into three sections:
- Account Code Balance Check: Extracting balances at the account code level to guarantee accurate capture and reconciliation of P&L balances with the account categories listed on the Profit and Loss tab. The Account code series is highly flexible, and users may adjust the settings to match their specific requirements at any time.
- P&L Balances: Displays total balances from the Profit and Loss tab for reconciliation with the Account Code balance section.
- Differences: Highlights reconciliatory differences between the Account code and account category sections, marked in red font for investigation

Managing Account Structures
The calculated transaction amounts are determined solely by the account codes mapped to the designated Account subcategory in Column D or the specified account code or range in Column E. This ensures the report is fully ready for use by anyone, 100% out-of-the-box.
However, as outlined earlier in this document, users have the flexibility to tailor this report to their specific needs. This is especially useful when the default subcategories don't quite fit the requirements.
Adding New Account Section
If users desire a structure beyond the provided account subcategories, they can leverage account groups set up in their ERP instance. However, caution is crucial to avoid overlap between account subcategories, preventing inaccuracies. Opting for a granular account subcategory list ensures data is accurate.
Users have two options when adding new account structure:
1. Re-purposing an existing Account subcategory:
- Rename an existing account subcategory line, replacing it with the desired custom account group.
- Ensure exact naming consistency with the ERP instance for Velixo to accurately return amounts.
2. Adding a Row in the Required BS Section:
- Use Excel functions to add a new row in the desired section.
- Be cautious with formulas in newly added rows; copying from existing rows in the same section ensures accurate results.
Removing an Account category
While users have the freedom to remove an account category, it's strongly discouraged as the report makes use of Velixo’s automatic hiding of rows with zero values, which has been configured on the Year-to-Date (YTD) Actual values.
This feature eliminates the need for manual deletions of account category rows and ensures the report remains fully dynamic should usage of account subcategories change over years or transactions get created against new account subcategories.
However, if an account category should really be deleted:
- Utilize Excel's delete row function for removal, followed by thorough data validation and reconciliation on the report.
- Always validate data accuracy using the Control sheet.
Version History
| Version | Released on | Remarks |
| 1 | N/A. Initial version of this template. |
Was this article helpful?
That’s Great!
Thank you for your feedback
Sorry! We couldn't be helpful
Thank you for your feedback
Feedback sent
We appreciate your effort and will try to fix the article